A 2026 rodent study investigated age-associated queuine decline. Queuine is characterized as a “longevity vitamin” in the cited 2018 review Prolonging healthy aging: Longevity vitamins and proteins, along with ergothioneine, astaxanthin, and taurine.
“The contribution of transfer RNA (tRNA)-specific modifications to aging remains largely unexplored. We systematically profile tRNA modifications across multiple organs, species, and senescence models, and identify mannosyl-queuosine (manQ) as the first tRNA-specific modification that consistently declines with age.
Across species, queuine supplementation extends lifespan and enhances healthspan. In naturally aging mice, long-term oral administration beginning at 16-months-old (human equivalent 50 years) extends mean lifespan by 15.3%, reduces DNA methylation age, improves cognitive and motor performance, strengthens antioxidant defenses, remodels the gut microbiota, and alleviates inflammation and metabolic dysfunction without detectable toxicity.
These findings establish tRNA epitranscriptomic remodeling as a previously unrecognized layer of aging regulation, and identify restoration of manQ through queuine supplementation as a multi-system strategy to delay aging.
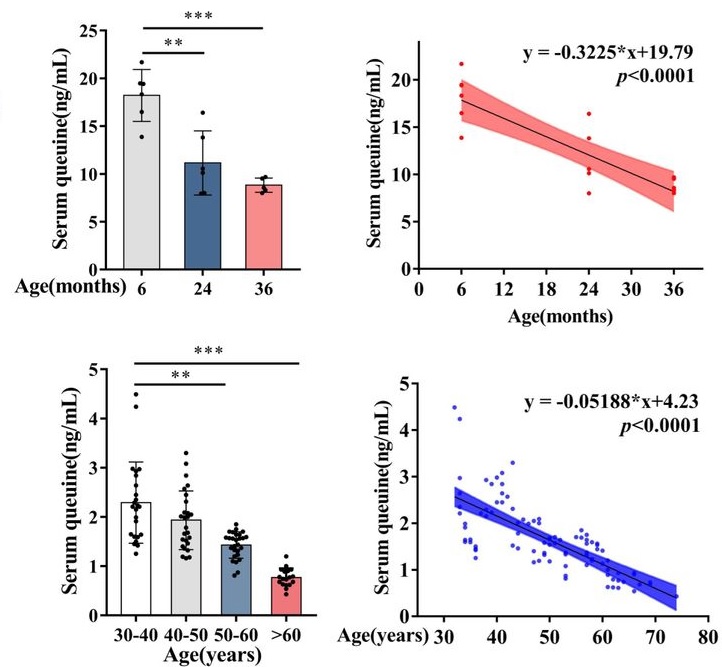
manQ hypomodification is selective rather than reflecting global tRNA depletion. Aging preferentially reduces the manQ-containing tRNAAsp fragment while leaving the corresponding unmodified tRNAAsp fragment, and other queuosine-modified tRNAs, relatively unchanged.
This pattern supports a regulated defect in modification homeostasis rather than a generalized change in transcript abundance. Such specificity argues that manQ loss is not merely a passive consequence of tissue degeneration, but instead represents a conserved, biologically meaningful aging-associated event with mechanistic impact.
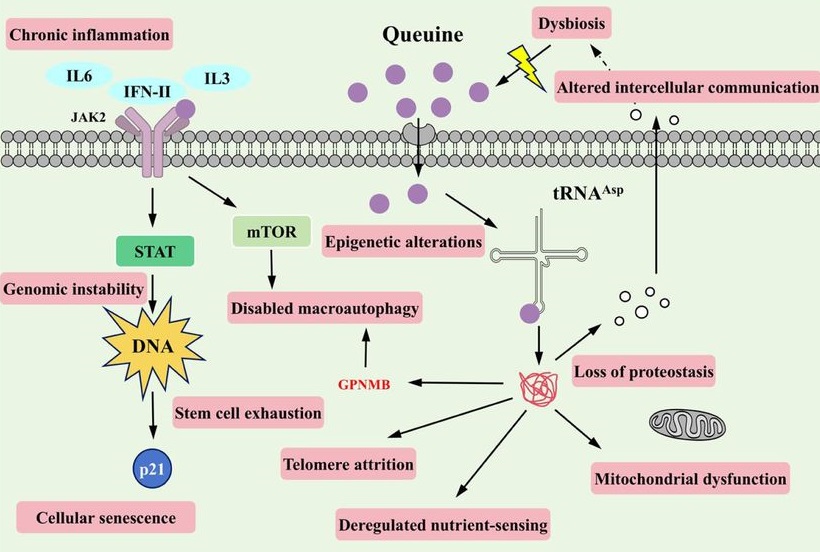
Because proteostasis intersects with multiple canonical hallmarks (e.g. mitochondrial dysfunction, impaired stress resilience, and altered intercellular communication), translation-coupled proteome destabilization offers a unifying explanation for how a single tRNA modification defect can elicit multi-system consequences. In this view, manQ decline is not merely one of many molecular changes observed in aging, but rather a proximate determinant capable of amplifying downstream hallmarks through a common axis of proteome quality control.
Our findings further suggest that manQ depletion may engage self-reinforcing feedback loops that accelerate aging trajectories. This architecture offers a conceptual framework in which aging progressively erodes ‘epitranscriptomic integrity’ at the tRNA level, pushing translation toward an error-prone regime that accelerates proteostatic collapse and functional decline.
A distinctive implication of this work is that queuine introduces a microbiota-host epitranscriptomic axis into aging biology. Queuine is produced by gut microbiota and cannot be synthesized de novo by mammals. These findings expand the conceptual scope of geroscience by placing a microbiota-derived nutrient upstream of translational quality control.
Queuine supplementation offers a distinct therapeutic logic: rather than modulating a single signaling cascade, it restores a tRNA modification state that governs translational fidelity – an upstream determinant of proteome quality that can, in principle, influence multiple downstream hallmarks concurrently. These findings highlight an intervention paradigm centered on restoring molecular fidelity, rather than suppressing a single downstream phenotype, as a strategy to delay systemic aging.”
https://www.biorxiv.org/content/10.64898/2026.03.22.713446v1.full “Evolutionarily Conserved Decline of tRNA Mannosyl-Queuosine Links Translational Regulation to Aging and Is Reversed by Queuine”
Treat your gut microbiota well. Give them what they want, and expect reciprocity.